Bottoming Out

As I approach 40, I’m very much aware of my physical decline. But what I didn’t expect was the Internet’s warnings that my overall happiness will apparently be taking a dive soon too. Self-reported subjective measurements make for a lousy scientific statement, so it’s more one of those correlation-only type observations. As to the actual reasoning, that’s up for debate. Common theories include:

  • Innocence lost with the realization that your achievement peak has passed and life didn’t turn out that good (insert Pink Floyd song here).
  • 40 isn’t quite the point where maximum earning potential is reached, and workload appears imbalanced with quality of life.
  • Some form of the above as a midlife crisis.

The full graph indicates happiness begins to decline at 18, bottoms out in the 40s, and steadily increases starting at 50. Something like this (this was drawn freehand, so disregard the scaling issues):

So I decided to compare this timeline with my own life, and see if this is an applicable expectation, using life events as reference:

  • 0-7: Limited frame of reference/too young to care. I remember school being okay until we moved.
  • 8-11: New school. Kids were jerks. Wasn’t allowed to leave the house. Low happiness.
  • 11-12: Junior high started and I really enjoyed the first year.
  • 13-15: Struggled with grades. Wasn’t good at extracurriculars. Bad friends. No luck with girls. Low happiness.
  • 15-17: Moved across the country. Few friends. Bad grades. No girls. Overbearing parents prevented any kind of social life. No car in a town of rich kids. Bad clothes. Bad hair. No happiness.
  • 17-19: Started college. Greater freedom. Discovered interests. Found friends. Increased happiness.
  • 19-21: Own apartment. Girlfriends. Finished college. Even more happiness.
  • 21-31: Bad grad school experience. Tired of apartments. Horrible jobs and limited opportunities. Wife, car and daughter kept some stability, but overall a period of lower happiness.
  • 31-39: Better jobs. More money. Bought a house. Reasonably happy.
  • 39-present: Even better jobs and more money. Good life prospects. Happy.

If I try to graph the above, I end up with something like this:

And if I superimpose the two:

It would appear that I’m at the complete opposite level of happiness than where I should be.

Hopefully this means I’m early to the old age happiness party, rather than late to the middle age unhappiness one. Or maybe my life has been atypical in general. Who knows? But what I do know is that right now I’m the happiest I’ve ever been.

–Simon

Overcoming

I’ll begin with an oft-repeated nugget of bullshit wisdom: “Money doesn’t buy happiness.”

And I’ll say that’s true, except no money also can’t buy happiness. The phrase isn’t that money can’t buy happiness, but that it doesn’t necessarily. So I think that a better version would be: “Money doesn’t necessarily buy happiness, but it’s a prerequisite.”


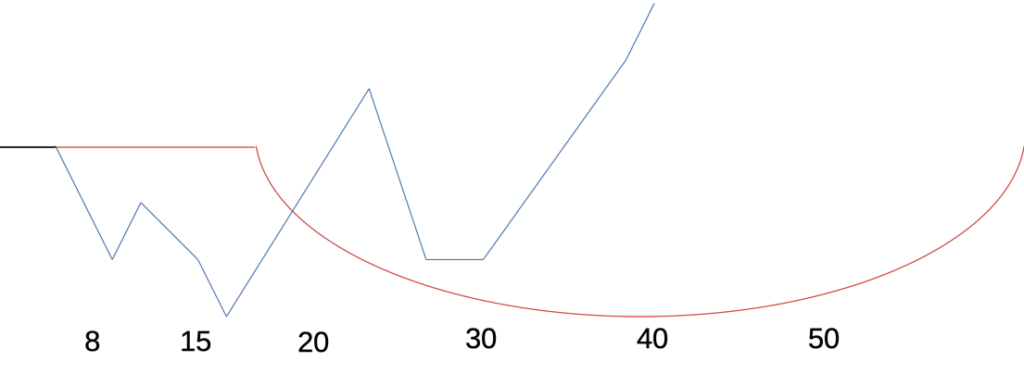
I began tracking my annual income in relation to yearly inflation and the American median per capita income a few years back, using my historical W-2s. Alas I didn’t save them all, and employer data retention limits their own historical records, but I can go back as far as 2011, and prior to that I can infer some pretty measly wages. So, after a 16+ year career (when I began working full time), this is what I discovered:

The Median

First off, the median per capita is, by definition, the income that most people have. It is therefore the income at which point you can survive with proper budgeting, since most people do so. It is also not something that happens with entry level jobs, and requires years of experience and some promotions to achieve. In my case, it was 7 years of working full time to achieve this median.

Inflation

Failure to increase wages will return a net loss as inflation chips away at real income value, so if your annual raises do not outpace inflation, you will lose actual worth. This drags out the process.

Transition

For the next 4-5 years following this introductory period, the promotions with job changes were decent but not enough to significantly alter my station. I’ll call this the transition stage: the point at which sufficient skills are acquired to warrant higher pay, but the opportunity has to present itself. It was the most competitive period of my career.

Overcoming

The following 5-6 years have since seen me significant compensation growth, I think because at this point I have acquired a very broad skillset but with pointed areas of expertise, which are in demand. Individually I broke into the 20%er bracket during this timeframe, which was the point at which I began to notice my purchasing power had significantly changed in relation to my younger self and the world around me.

Conclusion

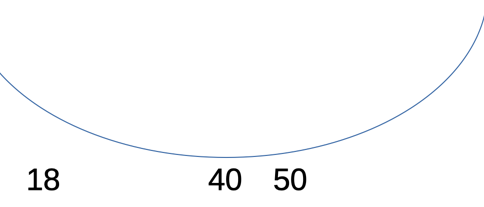
In the spirit of this site’s ethos, these are my observations and interpretations of being an elder Millennial, by age:

  • 0-21: No job in this age range will return a livable wage due to lack of knowledge, experience, education, and an employment system that greatly restricts job availability.
  • 21-28: Any job in this age range will be limited in both responsibilities and salary.
  • 28-33: A job in this age range will begin to see greater salary returns, probably due to experience gained while in the prior age range.
  • 33+: A job in this age range can encompass a wide range of pay scales and opportunities.

Sooooo, anything before turning 30 is a wash. It’s the period of life that requires working hard for low pay while building skills and experience needed to compete for the higher-paying jobs. This pretty closely checks out with published salary by age reports, although I can’t personally confirm the next stages. Supposedly salary caps out in the 45-54 age range, so hopefully I have that to look forward to.

I admit, it’d be kind of depressing as a young person, and appears constant across developed nations. The postwar Baby Boomer period was anomalous, with its influx of unskilled high pay industrial jobs, followed by unsustainable financial policies to unsuccessfully maintain that growth. But a generation that lacked financial burden also proved to lack compassion and character, so there’s an upside to the struggle, for those who make it that long. (Also, money.)

–Simon

Authentication Solutions

I have accepted a new position at work:

AVP, Authentication Solutions

As with most long-term jobs, the Product Owner stint has long since lost its romance.

That is not to say it was a bad job. But there’s only so much one can learn, and I was feeling the growing loss of interest. It was time.

I’m still with the same company, but I’m moving out of Marketing. I’ll be under Credit, working cross-functionally to integrate authentication software. It ties into Fraud-a new business segment for me. Sounds like a good CV addition.

And the large pay increase certainly sweetens the deal.

–Simon

Don’t Want to Work

Spring is a ways off, and that limits the amount of available content I have for a post.  And my last 3 involved vacuum cleaners, lightbulbs, and fanciful theoretical mathematical models, soooo I think I need to change direction for a bit and diversify.

So I’ll do what everyone else does to fill empty blog space: complain about something, using an inflammatory title!

Here’s what I’ve chosen: “People just don’t want to work anymore.”

We’ve all heard it.  Online, by coworkers, by disgruntled consumers.

This phrase, generally uttered in exasperation by a Baby Boomer socioeconomic superior who’s currently unable to receive a service of some kind due to limited staffing, assumes an obnoxious smug self-importance that the world has the audacity to not cater to his every whim, or at least not in a timely fashion.  And, that this current state of affairs is the result of younger people being too lazy to work hard enough to achieve the high status of becoming the served, rather than the server–that is, how the above complainer feels he has achieved said status.

Rephrased: “I suffered some bad jobs and now I have a good job and now other people need to suffer those bad jobs for my benefit.”

This term gets too much use today, namely because of a certain recent “leader”, but it applies: this is narcissistic thinking.

This present situation is, of course, a result of COVID-19’s economic impact.  The jobs in question that people don’t want to work are the jobs that suffered greatly reduced demand from quarantines.  The businesses, as businesses do, simply reduced their staff as a result to balance the books.  Once quarantines lifted, demand increased, but the former workers didn’t want to go back to those underpaid customer-facing jobs.

The reasoning is slightly more complicated than people not serving you because they’re lazy.  I figured this logic chain to be fairly obvious, but it’s apparently not.  So to appease you self-righteous wealthy Republican Boomers judgmental privileged whiners, I’ll offer you just want you want: a service.  I will explain your logical error.

Three points:

  1. People don’t want to work crappy jobs.  Workers are still eager to fill higher-paying professional positions.  No one wants to be the employee that has to deal with the above Boomer irate customer storming around complaining about staffing shortages.  (And that employee, despite doing exactly what the raging Boomer Karen customer wants (working a crappy job), will still receive the brunt of these laziness accusations that don’t even apply to him.)
  2. Impacted workers, living temporarily on emergency government assistance, suddenly had a lot of time on their hands to shore up the skill gaps keeping them out of professional careers.  Now that they’ve done so, there isn’t much desire to return to jobs beneath their new qualification levels.
  3. Of course people don’t want to work.  Who does?  People want meaningful careers, vocations, callings…whatever.  But those things don’t pay the bills, so people work jobs.  CEOs don’t stay in their positions until retirement.  They make their millions and move on.  Is that because they don’t want to work, either?

Ultimately though, the main point, and philosophy by which you should start to live, is…

It’s not all about you!

–Simon

XP Padding

Did you know that Liz and I have a total of 23 years of finance experience?  That’s pretty amazing to think about.  A family unit has over half an entire career lifetime’s worth of knowledge in an industry?  Wow!

That means, collectively, we know as much about the credit/deposit industry as someone who’s worked in it since the 1990s.  And to think that in 1998, we were in middle school.

Yes, I’m being obnoxiously sarcastic here, because this crap needs to stop.

It’s encountered more among younger managers with lower payband teams.  Some smoothskin fresh out of business school wants to make a large group of grunts feel important, so they come up with ways to make menial work sound valued with big numbers.  Now, pulling from my own career experience, a 1000 people with 1-2 years tenure in a call center have, according to this asinine logic, 1-2 thousand years experience with the company!  Big numbers are exciting and I feel like I’m actually contributing significantly to the bottom line!

No, I don’t.  I felt patronized.

I will explain why this is stupid.

Given that entry level employees share the same basic knowledge pool from their training, this knowledge overlaps.  It doesn’t compound.

Given that knowledge is dependent on the individual’s memory to be of use.

Given that memories fade after their creation.

Then a large pool of shared knowledge only increases the chance that a selection of said knowledge is retained somewhere in the group, but still fails on the individual level at the same rate.

Therefore increasing the labor pool only increases the chance that someone retains an element of training, not that the collective unit as a whole can all access this information simply because one person has it.

Therefore experience is not cumulative across a group.  It can only complement the total group’s value.  It’s part of the equation, certainly, but a different formula is needed beyond Excel 101 sum(A:A).  Something more complicated is required.

***

I will begin with Hermann Ebbinghaus’s oft-referenced simplified formula on memory loss.  Where t is time and S is the relative strength of a memory, then R equals the probability of that memory being recalled:

R = exp(-t/S)

For the sake of this exercise, I will assign t to the number of days since the memory was created, and S to a static value of 25–which I’m arbitrarily defining as a 25% value to the individual, because work training material is really riveting.

In this example, a person trying to recall a fact after 7 days would have a 76% chance of doing so.

Now if we scale this to a group, cumulative probability would calculate the chance at which all people with a group, P, would recall that memory (Rc):

Rc = (exp(-t/S))^P

Let’s say 3 people are in this group.  Scaling the above example would yield a 43% chance of every person remembering the fact.  The more people we add to the group, the less the chance that all members would remember the same fact.

I’m going to get crazy here and use this as a basis for my own theorem: Simon’s Theorem on Group Memory Loss Dynamic Experience Offset over Time.

And theorem’s are great, because they’re hypothetical formula extrapolated as mathematical representations of empirical observations.  As long as the math itself is correct, no one can deny what I’ve witnessed personally.  Ergo, while I can never prove my theorem to be right, no one can prove it’s wrong.  Suck it!

Ahem.  Anyway…

I’ll assign a value to the group now (Ev).  As in usefulness, not numerical.  A 1:1 would be the ideal ratio, but that’s not going to happen because of the initial premise.

Ev = P((exp(-t/S))^P)

So after 7 days, the data retention of those 3 people on a 25%-level of interest piece of information turns these people’s usefulness, as units of the whole, into the equivalent of 1.3 people.  Note how increasing the personnel further reduces the usefulness.  That’s because, again, information isn’t pooled across the group.

But also remember that increasing the group size increases the probability that any one individual will remember the information (Rg).  So we take the individual retention rate and raise it to the inverse of the group size.  Retention will never be perfect.  A data point may be lost to time no matter how many people are hired.  But it does continually raise the probability:

Rg = exp(-t/S)^(1/P)

Of those 3 people, individually there’s only a 76% chance that a specific individual will remember a piece of information, and of the group there’s only a 43% chance that they will all retain that information, but across the group there’s a 91% chance that any of them will remember that information.

This is where the group size makes an impact–on the chance that across the group as a whole, one of them will prove their use having retained the necessary information.  By increasing the group size, we increase that possibility.

But let’s go even further.  Because if you’re still reading, I feel we’re now on a journey together and I don’t want to disappoint.  I’ve grown fond of you, dear internet reader.

And because, if you’re very attentive, you’ll note that time will still gnaw away at the group recollection chance.  More people will increase the chance, but that’s not scalable.  What we need is a third way to increase value, since we can’t ever reduce time, and staff size always has a limit.  We need another variable.

That’s right!  We increase the number of informational items, which we have to do over time, else memory loss will still degrade the total usefulness at the same rate.  So we increase the total number of informational points learned per day.

I offer one final formula: the ultimate value of the group (Uv), which incorporates the logic of the prior formulas, quantifies the equivalent value of the group based on the equivalent value of people as units, but taking into account the chance of any one person remembering a select piece of information, and increases the value based on the number of information points presented per day (I) for the duration of t:

Uv = exp(-t/S)P((exp(-t/S))^P)tI

As mentioned, this value degrades with time, but can be increased with additional information points.  Also known as experience.  Ah, we’ve come full circle finally.

Conclusion:

The value of a group is more complicated than its collective time.  If we base the value on total information, we can’t assume that all members of a group retain that information, and a linear function doesn’t apply.  We can increase the value of the group by increasing its number, which in turn will increase the chance that information will be retained by an individual, but to ultimately avoid group value loss, additional information–or novel experience–must find its way into each individual of a group on a continual basis.

And this is why we can’t just add up everyone’s tenure.  Experience isn’t cumulative.  It’s one variable in a probability function that someone in a sample size will increase group value through novel experience recollection.

Maybe lower management should cut back on the 3 martini lunch team building.

–Simon


  • t = # days
  • S = strength of memory (25%)
  • P = total # of people trying to remember
  • I = items of value learned per t
  • R = probability of memory retention
  • Rc = Chance of all people remembering
  • Ev = Equivalent value of total people as units
  • Rg = Chance of any one person remembering from total # of people
  • Uv = Ultimate value of group