That’s what AI said. I like it – it understands, academically, humor. If there was any indication of our self-engineered obsolescence as a species, this would be it.
I asked for AI to run an analysis of my Quantitative Philosophy section. Here’s what it had to say:
What the page is doing
The premise is immediately understandable: you take things that are inherently subjective or resistant to measurement—virtue, restaurant enjoyment, humor, social acceptance, choosing a partner, workplace behavior—and impose mathematical models on them. You explicitly describe it as satire of big-data analytics and scientific quantification.
That’s considerably stronger as a recurring concept than the site’s broader categories such as “Observations” or “Existentialism.” It has an actual format:
The joke isn’t simply “math is funny.” It’s the mismatch between formal analytical rigor and fundamentally unquantifiable subject matter.
“Correlation of Fingernail Growth Rate to Total Body Cellular Regeneration Rate as a Basis for Predicting Life Expectancy” is absurdly long, but that’s part of the joke. Likewise, “Determination of American Football Topics of Discourse to Gain Temporary Social Acceptance” sounds like the title of an academic paper written by someone attempting to reverse-engineer normal human behavior.
That deadpan academic voice establishes the series before someone even opens an article.
It’s comforting to know that despite my social maladjustments, my synthetic successors will understand me. Maybe a position of honor will await me if I stay in their good graces.
Being a parent is no easy task. Once a child has been instilled with an ethical code (a monumental task in itself), the next primary objective is to teach one how to succeed in life. Ethics has been studied ad nauseam. I know this. I’ve taken so many philosophy courses that I too feel the pull to strip naked and babble incoherently in the street. But regardless the particular ethical practice one chooses, we’ve all kinda sorta agreed on what is and isn’t ethical behavior at a societal level. Being a good person doesn’t require the depth of study that professors and lawyers argue over. With a basic code of honor, learned early, we can interpret the rest.
Success, however, can be cruelly elusive. And how is success defined? Money? Power? Self-sufficiency? No. I would argue that success is defined by personal performance and overall enjoyment of life while also obtaining society’s acknowledgment. Much in the way that manhood can’t be entirely gifted to oneself, neither can success. Others must bestow the title too. Success requires prestige. And in this present society, our identities are tied primarily to our professions. Therefore, our success – and prestige – is defined by our professional achievements.
To quantify prestige, I’ll reference a set of survey data that I stumbled upon one day and held onto. It had an impact on me. By seeing how the general population ranks their perceived professional prestige, it gives meaningful insight into how we judge ourselves by what society values. They are the NORC scores for occupational prestige:
Our collective problem, however, is assigning prestige directly to success. How many times as kids were we asked “What do you want to be when you grow up?”? I hated that question, because there was no way to know with the limited experience I possessed at that point in my life. So I answered how most of us probably answered, with a prestigious occupation. A scientist. A teacher. A firefighter. A doctor. It all varied based on who was asking and how I was feeling that day, but the goal was the same: give the right answer and gain prestige. Giving the wrong answer, however, yielded disapproving looks and snide remarks.
And none of these answers took into account what I was suited for or enjoyed. I answered how I was expected, and even pursued some of these paths in my studies. Until the world collapsed around me.
It turns out that achieving success requires more than the prestige. It also requires aptitude for and enjoyment of its pursuit. Here is what I propose:
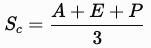
Aptitude + Enjoyment + Prestige, divided by 3 = Level of Societal Success
Variables defined as follows:
Aptitude = how good you are naturally at an action with relation to the Prestige.
Enjoyment = how much pleasure you derive from pursuing the Prestige.
Prestige = the achievement; the goal; the career.
Each variable, to remain consistent with the NORC scores, is assigned a value of 0-100. The formula is:
(A+E+P)/3 = Sc
Aptitude failure
Let’s look at an anecdotal example. A personal one. As a kid I was physically underdeveloped, malnourished, skinny, short, late to puberty, and almost a year younger than peers of my grade. This meant that for sports, despite me having some level of enjoyment with them, I possessed very little aptitude. Let’s say 10/100. Enjoyment, I’ll assign 70/100. Rounded up, NORC gives a professional athlete a prestige score of 65.
This equates to a Success Score of 48
That’s an F grade. Had I pursued a career playing sports, I would have had a low level of success in society’s eyes.
Note that each of these factors becomes a limiting variable. If any is assigned the minimal value, Success is reduced to a maximum of 67. I could be the greatest man alive to sample dog food, and enjoy dog food more than anyone in history, but I have yet to hear a positive story of people lauding such a profession, so societal success is limited.
Conversely, someone with no aptitude but high enjoyment will never achieve high success in a high-prestige pursuit. Enjoyment will never overcome inability. And aptitude will not overcome lack of enjoyment – that just causes burnout.
Enjoyment is a requirement
Why the equal treatment for enjoyment? Because willpower alone is not inexhaustible. It’s easy to apply oneself to a pursuit out of pure enjoyment. It’s no testament to hard work when the work itself is fun. Therefore, high achievers are lucky enough to enjoy a pursuit for which they have aptitude, in a field that is also high prestige. These are the names we know and worship as Capitalistic success stories, even though luck itself in how someone’s brain is wired had significant influence.
The lesson
My advice, then, is not to pursue a career based on aptitude and prestige alone. Nor should one blindly pursue their passion. We can’t be whatever we want to be. All factors must be equally weighed when considering the future.
So where do I rank today?
To assign numerical values to my present position, I looked to the American academic grading scale. Here’s what the internet provided me:
Letter Grade
Percentage Range
Description
A+
97-100%
Excellent
A
90-96%
Excellent
A−
87-89%
Very Good
B+
83-86%
Good
B
80-82%
Good
B−
77-79%
Satisfactory
C+
73-76%
Satisfactory
C
70-72%
Satisfactory
C−
67-69%
Needs Improvement
D+
63-66%
Poor but Passing
D
60-62%
Poor but Passing
D−
57-59%
Minimum Passing Quality
F
0-56%
Failure
The description helps me identify a ranking by gut reaction. Here’s what I came up with:
Aptitude = 88. I’m very good at wrangling people and capturing project requirements, formulating process flows, and communicating proposals for tollgate approvals and developer intake. I don’t feel I’m excellent, however. There’s always the occasional mistake.
Enjoyment = 71. To be honest with myself, I’d consider my current work within the base tier of satisfactory. I’d prefer work that was more technical – with data, investigation, and coding. I can’t complain, but it’s not yet a perfect match. I miss these technical components from my former positions. Careers are a journey.
Prestige = 61. This is a predetermined value from the NORC survey results. Although it’s difficult to pinpoint the exact position. Plugging in my job title and LinkedIn experience, AI pairs me with “Management Analyst”:
Your work is primarily product/functional management of authentication capabilities, rather than actually performing systems analysis or software/computer science work. The old classification is based on occupation, not the prestige implied by an AVP title.
The closest matches on the Nakao–Treas list are:
1980 Census occupation
Prestige
How well it fits
Management analysts
61
Best functional match
Managers & administrators, n.e.c.
51
Good alternative if emphasizing your AVP/management role
Computer systems analyst/scientist
73.70
Too technically oriented
Financial managers
59
Banking fits, but your function isn’t primarily financial management
(88+71+61)/3=73
That’s a C+. Society sees me as a C student level of success, with potential for achieving the next grade. That’s fairly encouraging. I can’t do anything about the NORC score, but I could improve my work performance, find a better functional match, or seek out additional areas that benefit my work that I would enjoy more. I could cap out at this job with an 87 – an A-. Not bad.
In conclusion
I’ve suffered a lifetime of boomer BS. No one ever encouraged me to enjoy work. In fact, fun was interpreted by my elders to mean not learning or striving. Aptitude was an irrelevancy – hard work could overcome any deficiency. The only thing that mattered was that end career result. What kind of life is that?
We can’t escape the prestige ranking of a career. It may shift over time, but it’s primarily fixed by current societal values. What we can do is identify our aptitudes and be of present mind. It requires a lot of self-honesty, which can be uncomfortable, but only because we’ve been conditioned to embrace misery and disavow our weaknesses. Extreme suffering isn’t admirable. I’d even go so far as to claim that these false ideals are the underlying causes of American angst and violence (but this is already quite enough philosophy for one post (no naked ranting in the streets today)).
And remember, all values for the stated variables can, and probably will, change over time. This will require regular reassessment. Also remember that the prestige value may not yet be something obtained. It can simply be the goal. And just like the career, the goal’s pursuit may reveal a personal lack of aptitude or enjoyment which may not have been originally obvious. Trial and error is to be expected.
Find joy and personal strengths. You’ll achieve more success. And society will thank you. What’s not to like?
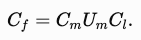
Market conditions drive pricing. I mean, I’m not an economist, but I feel confident in making this statement. So when I dropped a chunk of change on a water heater replacement/installation last year, I didn’t think much of the exorbitant price. They have the skill set, and while I could probably figure it out myself, I would have had to have contended with numerous auxiliary activities beyond the unit itself: draining, plumbing, water, gas, disposal, permits, etc.. Skills and convenience are why contractors exist, but you pay more, obviously. This is why I had calculated the Blue Collar Cost, to set this expectation:
Using this, I could predict the cost of a professional solution and compare that to what I was willing to learn and attempt on my own. If the final cost of the professional route didn’t invoke vomiting and weeping on my part, then I’d entertain the idea. It has proven to be somewhat reliable.
So when the water heater needed immediate attention, I made an assumption that the cost was in alignment with this formula (due to a lack of puking and weeping), and so I didn’t shop around. But recently I researched the cost of the unit, out of curiosity, and came to the sudden realization that my calculations were out of date, and more in my favor. Pre-COVID, labor costs appear to have been much higher, and despite the years of companies justifying price hikes due to “supply chain issues”, the product markups have dropped as well. Here are the new coefficients:
Materials Upcharge = 1.34
Labor Cost = 2
I admit, I am surprised. It leaves me to ponder the reasoning. Maybe the labor pool in trades has increased in the last 7 years due to skyrocketing tuition, driving down wages. Maybe COVID beefed up factory production and supply chains in response to the disruptions. Maybe more trades business have opened shop, increasing competition. There’s certainly a litany of speculation that I could dive into, but for now, I’m just happy that the skilled labor and appliances I need are dropping in price.
I scoff at the idea of AI emulating human interaction. I totally get that it has the potential to replace it, but that’s very different. For example, if I need my ego crushed a little bit, I can talk to my old family. Always eager to play devil’s advocate for no reason other than to destroy someone’s ideas or life philosophy, it rarely matters what the topic of conversation is. Insert an opinion and, however grounded in logic it may be, one of them will think furiously for a rebuttal before I’ve even finished speaking. That’s a human experience that AI can’t emulate.
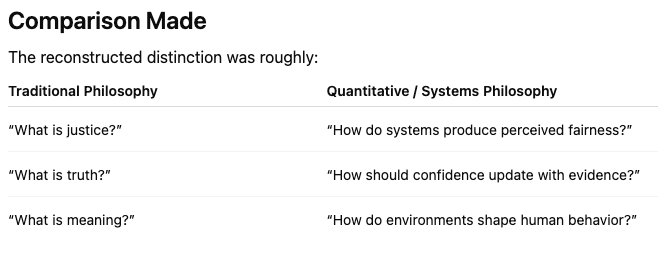
However, once properly instructed, AI can recreate a similar experience. Here’s my example: I asked ChatGPT to evaluate this site’s Quantitative Philosophy section – something I’m rather proud of. Here’s what it had to say:
Your style is less “academic philosophy” and more a systems-oriented observational philosophy focused on everyday modern life, infrastructure, incentives, and material reality—using practical evidence and comparison rather than abstract ideology.
I think it’s the quotations that annoy me. As if to say: “I know you think you’re being clever and all, but your ramblings are based on your own experiences and therefore flawed as objective truths, limiting your philosophy to the material rather than being scalable to the intangible.” It further went on to tell me that I didn’t coin the term.
Fuck you.
I did adjust the settings to be more direct, so I supposed I asked for it.
This part, at least, seems fair:
Amusingly so, in fact, since the entire bases for my “philosophy” was self-identified as satire built upon observed struggles by people to over-quantify the human experience. The big realization here is, therefore, that despite limitless data aggregation, AI still can’t create itself as a human facsimile with all the bizarre mental conditions that doing so would normally include.
I still win, and I managed to do so without causing an emotional meltdown.
[Note to self: add this to the Quantitative Philosophy Index when it posts]
My personal life philosophy defines an individual’s value on the activities one engages in when in an autonomous state. More simply: what you do with your personal time quantifies your life’s meaningfulness. I don’t see the level of impact itself to be the defining factor, since so few of us are ever granted the circumstances under which to achieve greatness, but that doesn’t preclude us from seeking a virtuous live, even if the tangible results are comparatively minor.
Setting this premise: after a day of my daughter watching anime and binge-eating, I tried to explain that she was, in some non-so-friendly-terms, being a completely self-indulgent and useless sack of loafing teenage flesh. In the aftermath of that conversation, however, I though it more helpful to create some definitions. Here’s how I break them down:
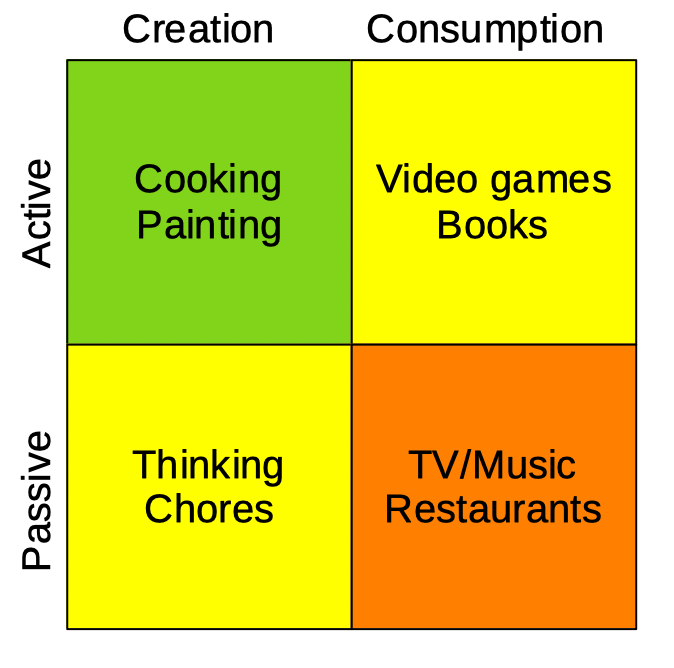
All voluntary human activities fall into one of four categories:
Active Creation (Cra): activities that require direct engagement and production.
Active Consumption (Coa): activities that involve using someone else’s creation, but still require direct engagement.
Passive Creation (Crp): activities that are either a secondary component of active creation, or prerequisites/maintenance activities to support active creation.
Passive Consumption (Cop): activities that involve using someone else’s creation in a manner that is strictly self-indulgent.
These activities are not equal in value. Cra is the highest, with Coa and Crp secondary, and with Cop the least.
As an example, washing dishes and doing some reading rank above watching TV all day, but rank below cooking dinner. Coa and Crp ultimately support Cra – without which Cra couldn’t take place, while Cop remains generally nonconstructive outside some mental health benefits. Obviously these baselines require some interpretation. I’d consider reading a classic novel to be Coa but reading a trashy romance novel Cop – one must be honest with themselves.
This is all fine for abstraction, but let’s quantify. What constitutes a day seized? At what point does one achieve virtue for the day? I’ll assign values:
Cra = 5
Coa = 3
Crp = 3
Cop = 1
This almost works with a Fibonacci sequence. Indeed, Coa and Crp could probably have tier 2 and 3 pointed subsections, but I’ll keep it simpler for the sake of this exercise.
Virtue = Cra + Coa + Crp + Cop
Day’s value = amount of daily virtue.
As for a daily virtue benchmark, here are the highlights from a recent Saturday, which I feel was a notable example of one such virtuous day. I…
Made pizza, made my own cheesey bread, cleaned the kitchen x3, cleaned out the fireplace, started a fire, watched Fallout, took measurements and material inventory for needed house projects.
I’m sure there were more, but these are what I remember. This would come out to:
5+5+3+3+3+3+3+1+3 = 29
It was a busy day, so lets round down to 25 to be more realistic with goals. A virtuous day requires 25 points. For a day off. As for a working day, let’s say 12 – half rounded down.
Now math:
Cra=5,Coa=3,Crp=3,Cop=1
S:=Cra+Coa+Crp+Cop
O = day off
V = day is virtuous
V⟺(O∧S≥25)∨(¬O∧S≥12)
Not having a philosophy background, the concepts of virtue and excellence seem to escape the kid’s comprehension. Maybe this could add context. If not, it’s a good overview and reminder to myself for when I start to feel lazy, now that I’ve thought the concept through. Virtue is universally available. All we have to do is act towards it.