
Did you know that Liz and I have a total of 23 years of finance experience? That’s pretty amazing to think about. A family unit has over half an entire career lifetime’s worth of knowledge in an industry? Wow!
That means, collectively, we know as much about the credit/deposit industry as someone who’s worked in it since the 1990s. And to think that in 1998, we were in middle school.
Yes, I’m being obnoxiously sarcastic here, because this crap needs to stop.
It’s encountered more among younger managers with lower payband teams. Some smoothskin fresh out of business school wants to make a large group of grunts feel important, so they come up with ways to make menial work sound valued with big numbers. Now, pulling from my own career experience, a 1000 people with 1-2 years tenure in a call center have, according to this asinine logic, 1-2 thousand years experience with the company! Big numbers are exciting and I feel like I’m actually contributing significantly to the bottom line!
No, I don’t. I felt patronized.
I will explain why this is stupid.
Given that entry level employees share the same basic knowledge pool from their training, this knowledge overlaps. It doesn’t compound.
Given that knowledge is dependent on the individual’s memory to be of use.
Given that memories fade after their creation.
Then a large pool of shared knowledge only increases the chance that a selection of said knowledge is retained somewhere in the group, but still fails on the individual level at the same rate.
Therefore increasing the labor pool only increases the chance that someone retains an element of training, not that the collective unit as a whole can all access this information simply because one person has it.
Therefore experience is not cumulative across a group. It can only complement the total group’s value. It’s part of the equation, certainly, but a different formula is needed beyond Excel 101 sum(A:A). Something more complicated is required.
***
I will begin with Hermann Ebbinghaus’s oft-referenced simplified formula on memory loss. Where t is time and S is the relative strength of a memory, then R equals the probability of that memory being recalled:
R = exp(-t/S)
For the sake of this exercise, I will assign t to the number of days since the memory was created, and S to a static value of 25–which I’m arbitrarily defining as a 25% value to the individual, because work training material is really riveting.
In this example, a person trying to recall a fact after 7 days would have a 76% chance of doing so.
Now if we scale this to a group, cumulative probability would calculate the chance at which all people with a group, P, would recall that memory (Rc):
Rc = (exp(-t/S))^P
Let’s say 3 people are in this group. Scaling the above example would yield a 43% chance of every person remembering the fact. The more people we add to the group, the less the chance that all members would remember the same fact.
I’m going to get crazy here and use this as a basis for my own theorem: Simon’s Theorem on Group Memory Loss Dynamic Experience Offset over Time.
And theorem’s are great, because they’re hypothetical formula extrapolated as mathematical representations of empirical observations. As long as the math itself is correct, no one can deny what I’ve witnessed personally. Ergo, while I can never prove my theorem to be right, no one can prove it’s wrong. Suck it!
Ahem. Anyway…
I’ll assign a value to the group now (Ev). As in usefulness, not numerical. A 1:1 would be the ideal ratio, but that’s not going to happen because of the initial premise.
Ev = P((exp(-t/S))^P)
So after 7 days, the data retention of those 3 people on a 25%-level of interest piece of information turns these people’s usefulness, as units of the whole, into the equivalent of 1.3 people. Note how increasing the personnel further reduces the usefulness. That’s because, again, information isn’t pooled across the group.
But also remember that increasing the group size increases the probability that any one individual will remember the information (Rg). So we take the individual retention rate and raise it to the inverse of the group size. Retention will never be perfect. A data point may be lost to time no matter how many people are hired. But it does continually raise the probability:
Rg = exp(-t/S)^(1/P)
Of those 3 people, individually there’s only a 76% chance that a specific individual will remember a piece of information, and of the group there’s only a 43% chance that they will all retain that information, but across the group there’s a 91% chance that any of them will remember that information.
This is where the group size makes an impact–on the chance that across the group as a whole, one of them will prove their use having retained the necessary information. By increasing the group size, we increase that possibility.
But let’s go even further. Because if you’re still reading, I feel we’re now on a journey together and I don’t want to disappoint. I’ve grown fond of you, dear internet reader.
And because, if you’re very attentive, you’ll note that time will still gnaw away at the group recollection chance. More people will increase the chance, but that’s not scalable. What we need is a third way to increase value, since we can’t ever reduce time, and staff size always has a limit. We need another variable.
That’s right! We increase the number of informational items, which we have to do over time, else memory loss will still degrade the total usefulness at the same rate. So we increase the total number of informational points learned per day.
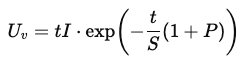
I offer one final formula: the ultimate value of the group (Uv), which incorporates the logic of the prior formulas, quantifies the equivalent value of the group based on the equivalent value of people as units, but taking into account the chance of any one person remembering a select piece of information, and increases the value based on the number of information points presented per day (I) for the duration of t:
Uv = exp(-t/S)P((exp(-t/S))^P)tI
As mentioned, this value degrades with time, but can be increased with additional information points. Also known as experience. Ah, we’ve come full circle finally.
Conclusion:
The value of a group is more complicated than its collective time. If we base the value on total information, we can’t assume that all members of a group retain that information, and a linear function doesn’t apply. We can increase the value of the group by increasing its number, which in turn will increase the chance that information will be retained by an individual, but to ultimately avoid group value loss, additional information–or novel experience–must find its way into each individual of a group on a continual basis.
And this is why we can’t just add up everyone’s tenure. Experience isn’t cumulative. It’s one variable in a probability function that someone in a sample size will increase group value through novel experience recollection.
Maybe lower management should cut back on the 3 martini lunch team building.
–Simon
- t = # days
- S = strength of memory (25%)
- P = total # of people trying to remember
- I = items of value learned per t
- R = probability of memory retention
- Rc = Chance of all people remembering
- Ev = Equivalent value of total people as units
- Rg = Chance of any one person remembering from total # of people
- Uv = Ultimate value of group

 Of course, that nightmarish formula is more readily understood in its natural format: a spreadsheet, so naturally I’ve provided it along with instructions: